Skip to contents

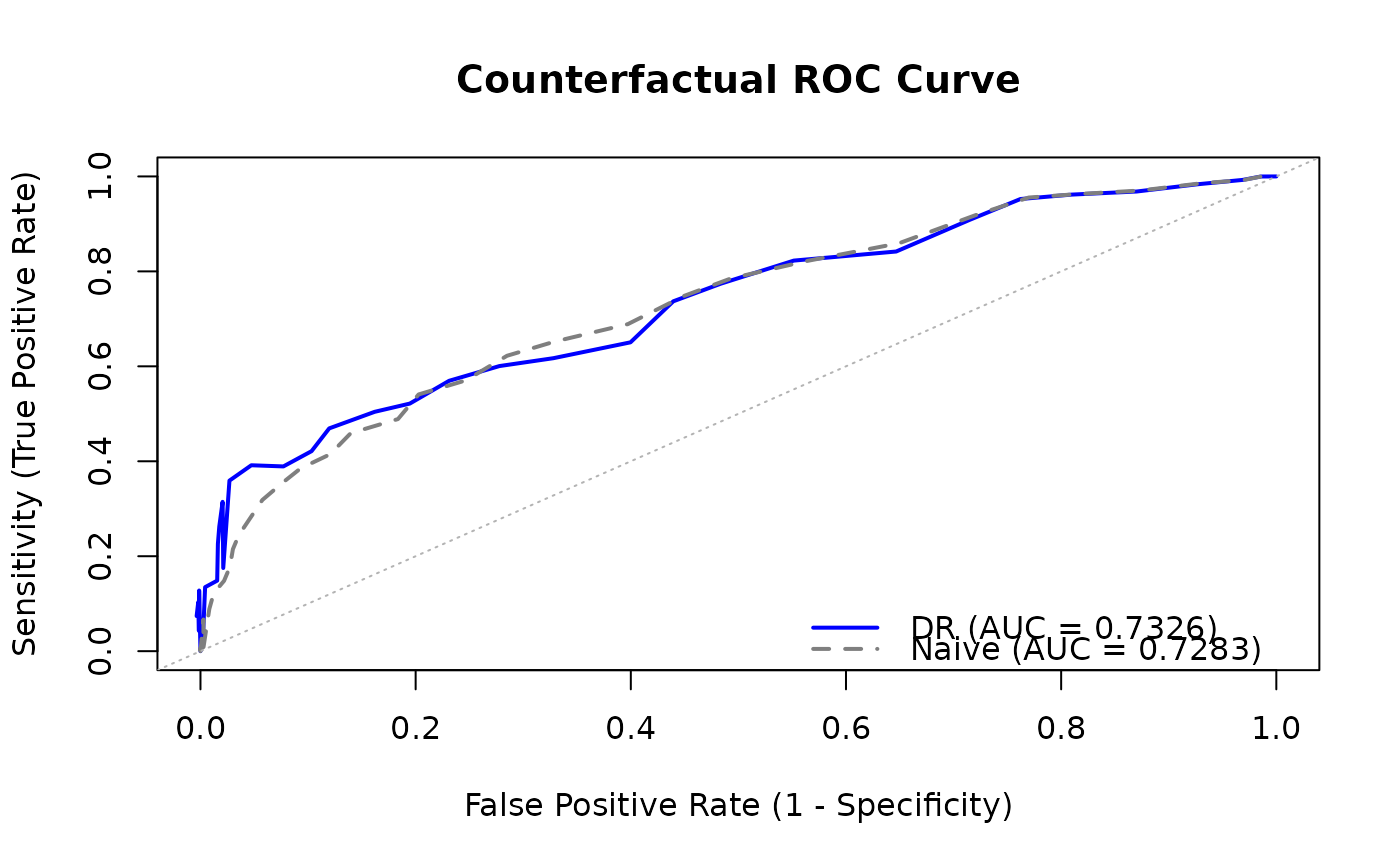
Creates a plot of the ROC curve.

Usage

# S3 method for class 'tr_roc'
plot(
  x,
  add_diagonal = TRUE,
  show_naive = TRUE,
  main = NULL,
  col = "blue",
  naive_col = "gray50",
  lwd = 2,
  ...
)

# S3 method for class 'cf_roc'
plot(
  x,
  add_diagonal = TRUE,
  show_naive = TRUE,
  main = NULL,
  col = "blue",
  naive_col = "gray50",
  lwd = 2,
  ...
)

Arguments

x

An object of class tr_roc or cf_roc.

add_diagonal

Logical indicating whether to add a diagonal reference line (representing random classifier). Default is TRUE.

show_naive

Logical indicating whether to show the naive ROC curve if available. Default is TRUE.

main

Title for the plot.

col

Color for the ROC curve. Default is "blue".

naive_col

Color for the naive ROC curve. Default is "gray50".

lwd

Line width. Default is 2.

...

Additional arguments passed to plot().

Value

Invisibly returns the input object.

Examples

set.seed(123)
n <- 500
x <- rnorm(n)
a <- rbinom(n, 1, plogis(-0.5 + 0.5 * x))
y <- rbinom(n, 1, plogis(-1 + x - 0.5 * a))
pred <- plogis(-1 + 0.8 * x)

roc <- cf_roc(
  predictions = pred,
  outcomes = y,
  treatment = a,
  covariates = data.frame(x = x),
  n_thresholds = 51
)
plot(roc)